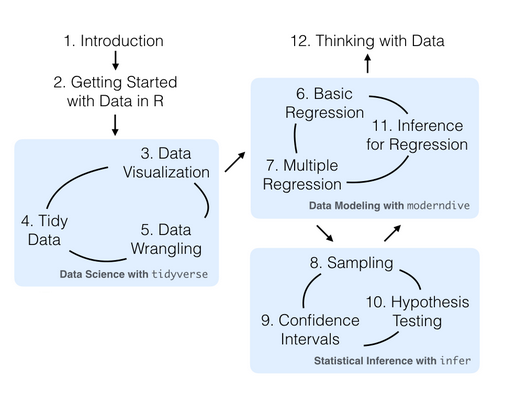
Chapter 2 Data
Data Science Toolbox
data visualization, data formatting, data wrangling, and data modeling using regression.
With these tools, you’ll be able to perform the entirety of the “data/science pipeline” while building data communication skills.
- data collection
- data wrangling
- data visualization
- data modeling
- inference
- correlation and regression
- interpretation of results
- data communication
"There’s a reason so many fields require a statistics course. Scientific knowledge grows through an understanding of statistical significance and data analysis. Paired with computation, you’ll see how reproducible research in the sciences particularly increases scientific knowledge."
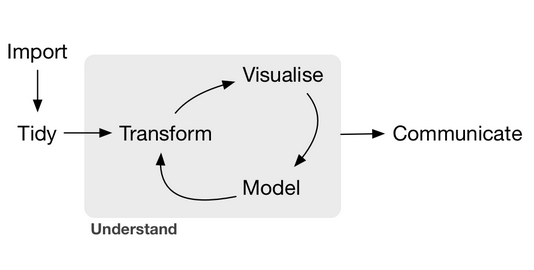
It’s all about the data
make use of R packages for rich, real, and realistic data-sets that at the same time are easy-to-load into R.
Grammar of Graphics as implemented in the ggplot2 package is the best way to impart such lessons.
dplyr has made data wrangling much more accessible, and hence much more interesting data-sets can be explored.
hat balance being:
- Rich enough to answer meaningful questions with,
- real enough to ensure that there is context, and
- realistic enough to convey to researchers that data as it exists “in the wild” often needs processing.
- Easily and quickly accessible to novices, so that we minimize the prerequisites to research.